 Global Data Catalogue
Type of resources
Available actions
Topics
Keywords
Contact for the resource
Provided by
Years
Formats
Representation types
Update frequencies
status
Scale
Resolution
-
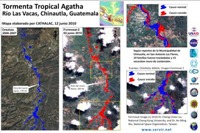
Using Orthophotos and Formosat-2 satellite images, floods were identified along Rio Las Vacas in Chinautla, Guatemala. Formosat image © 2010 Dr. Cheng-Chien Liu, National Cheng Kung University; Dr. An-Ming Wu, National Space Organization, Taiwan; Global Earth Observation and Data Analysis Center (GEODAC), Taiwan.
-

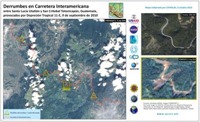
Heavy rains make mountainous regions particularly susceptible to the risk of landslides. SERVIR Mesoamerica created the following product, focusing on population centers that received a cumulative rainfall of over 100 mm day from May 23-29, 2010. (data from NOAA's GOES satellite).
-
Shapefile of identified flooded areas in the southwestern part of Guatemala.
-
Landsat 5 Thematic Mapper (TM) surface extent data for Lake Atitlan in GIS format for December 9, 2009 (ZIP of .shp files). Area in hectares = 12225.5
-
Lake Atitlans surface extent data in GIS format for the different dates evaluated
-
Lake Atitlans surface extent data in GIS format for the different dates evaluated
-
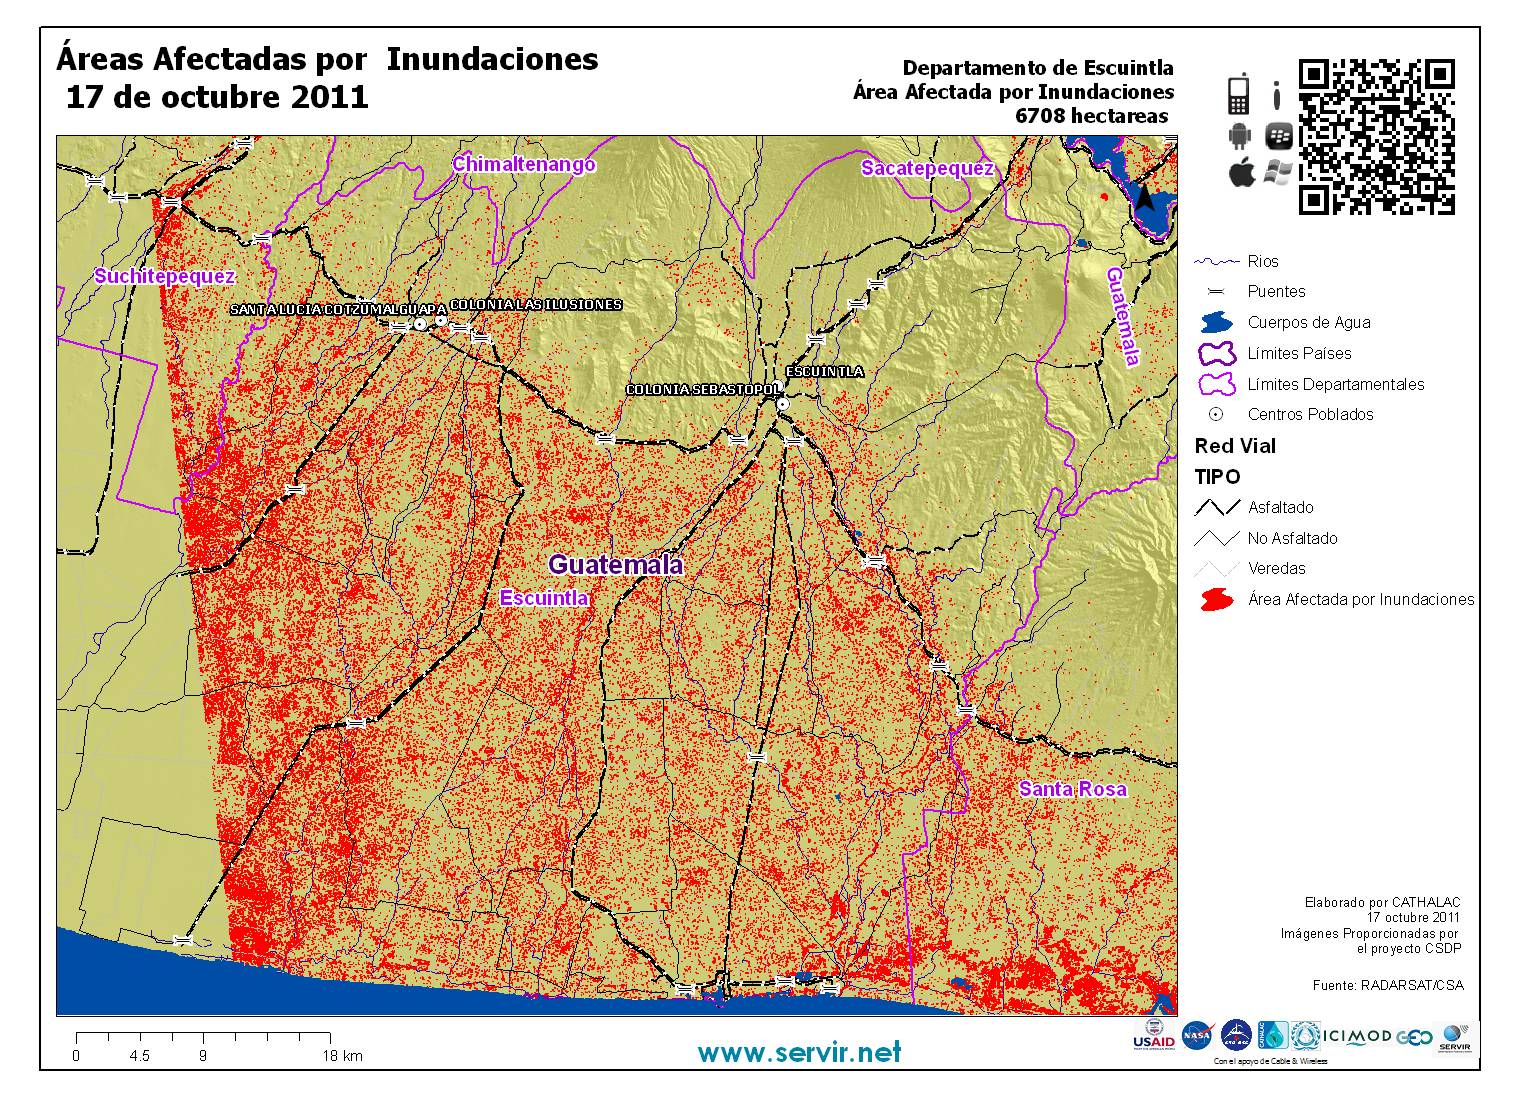
Areas affected by flooding in the Department of Escuintla. Captured on 17 October 2011 by RADARSAT-2. Data provided by Canadian Space Agency.
-
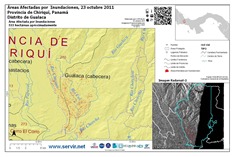
This image was captured on 23 October 2011 by RADARSAT-2. The area affected by floods in the District of Gualaca is approximately 1,317 acres (533 hectares). Data provided by the Canadian Space Agency in the context of the pilot project for satellite monitoring of the Caribbean (GEO).
-

Using precipitation data, landslide susceptibility based on slope, and populated areas, SERVIR developed this analysis that identifies populated areas threatened by landslides.
-
Lake Atitlans surface extent data in GIS format for the different dates evaluated